plot_acrophase_clock
Summary
plot_acrophase_clock draws circular phase values on a polar clock. Use it for
subject-level acrophase, activity onset, L5/M10 start time, or any other cyclic
time column.
Registry name: acrophase_clock.
Example figure
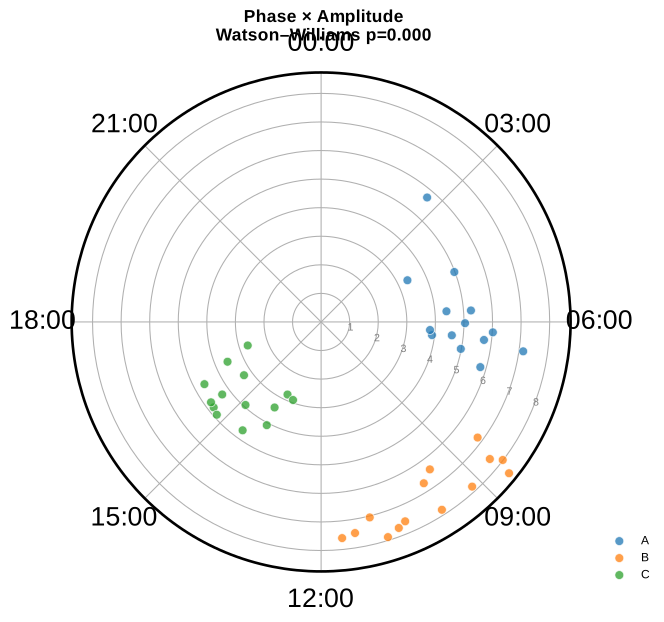
Circular acrophase clock; the three groups cluster at different phases. Rendered from the synthetic example dataset.
Signature
plot_acrophase_clock(
    experiment,
    phase_col="Acrophase (h)",
    group_col=None,
    period=24.0,
    radius_col=None,
    group_order=None,
    specificity=None,
    filter_by=None,
    palette=None,
    title=None,
    save=True,
    save_path=None,
    save_name=None,
    subfolder=None,
    montage=False,
    dpi=600,
    return_data=False,
)
Input Object Types
| Object type | Accepted? | Notes |
|---|---|---|
Batch |
Yes | Uses batch.summary. |
Experiment |
Yes | Uses experiment.summary. |
MiniExperiment |
Yes | Works when its summary contains the needed phase column. |
pandas.DataFrame |
Yes | Used directly as the subject-level frame. |
Parameters
| Parameter | Type | Default | Meaning |
|---|---|---|---|
experiment |
PyFLASH-like object or DataFrame |
required | Source with a subject-level summary table. |
phase_col |
str |
"Acrophase (h)" |
Circular time column in the same units as period. |
group_col |
str or None |
None |
Group column used for colour and circular group tests. |
period |
number | 24.0 |
Cycle length. Use 24 for hours on a daily clock or 12 for months. |
radius_col |
str or None |
None |
Optional numeric radius, such as amplitude. Without it, radius is visual jitter only. |
group_order |
list-like or None |
None |
Explicit group order for colour and legend stability. |
filter_by |
dict, tuple, list, or None |
None |
Preferred row filter. Lists run queue mode. |
palette |
palette, dict, or None |
None |
Group colour palette or mapping. |
title |
str or None |
None |
Figure title. Default is based on phase_col, group_col, and radius_col. |
save |
bool |
True |
Save the figure. |
save_path |
Path-like or None |
None |
Base output folder override. |
save_name |
str or None |
None |
File stem override. Default is <phase_col>_clock. |
subfolder |
str or None |
None |
Optional subfolder passed to the save helper. |
montage |
bool |
False |
Mark saved figure for montage collection when a pipeline has armed montage capture. |
dpi |
int |
600 |
Save DPI. |
return_data |
bool |
False |
Return circular statistics with the figure. |
Returns
| Return value | Type | Meaning |
|---|---|---|
fig |
matplotlib.figure.Figure |
Returned by default. |
(fig, stats) |
tuple | Returned when return_data=True. stats contains circular summaries and a group test. |
result |
dict |
Queue mode returns a dictionary keyed by filter value. |
The stats dictionary includes period, per-group circular statistics, and
either a watson_williams result when there are two or more groups or a
rayleigh result for one group.
Saved Outputs
With save=True, the figure is saved through save_fig() to either
save_path or the source object's standard figure folder. The default file stem
is:
The function also emits a structured circular-phase record through the describe/report layer when that layer is active.
Examples
Plot acrophase by group without saving
from PyFLASH.plotting import plot_acrophase_clock

fig, stats = plot_acrophase_clock(
    batch,
    phase_col="Acrophase (h)",
    group_col="Diagnosis",
    period=24,
    save=False,
    return_data=True,
)

print(stats["groups"])
Use amplitude as the radius
plot_acrophase_clock(
    batch.summary,
    phase_col="Acrophase (h)",
    group_col="Diagnosis",
    radius_col="Amplitude",
    group_order=["Control", "MCI", "AD"],
    save=False,
)
Queue filters
figures = plot_acrophase_clock(
    batch,
    phase_col="Acrophase (h)",
    group_col="Diagnosis",
    filter_by=[{"Sex": "Female"}, {"Sex": "Male"}],
    save=False,
)

print(figures.keys())
Notes
- The function raises
ValueErrorifphase_colis missing. phase_colvalues are converted to numeric and rows with missing phase values are dropped.- Without
radius_col, all points sit in one outer band with slight jitter so overlapping phases can be seen. Do not interpret radius in that mode. - With two or more groups, the title includes Watson-Williams p when finite. With one group, the statistics include a Rayleigh test for non-uniform phase clustering.
- Circular means wrap around the cycle. Times near 0 and times near
periodare neighbours.