plot_scatter_3d
Summary
plot_scatter_3d draws three numeric summary columns on a 3D scatter plot. It
can save one figure per condition or factor level, overlay all groups on one
combined axis, queue over several x/y/z column combinations, and share axis
limits across queued sibling plots.
Registry name: scatter_3d.
Example figure
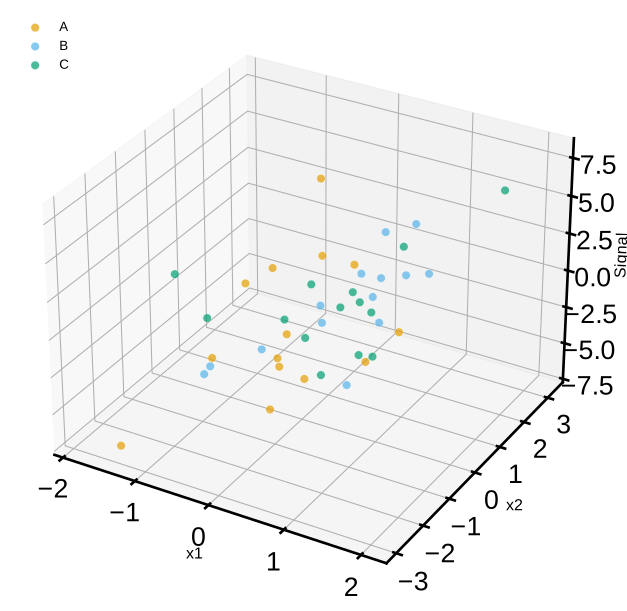
x1×x2×Signal in 3D, coloured by group. Rendered from the synthetic example dataset.
Signature
plot_scatter_3d(
    experiment,
    x,
    y,
    z,
    by="conditions",
    factor=None,
    specificity=None,
    filter_by=None,
    roi=None,
    save=True,
    combine=False,
    x_range=None,
    y_range=None,
    z_range=None,
    xmin=None,
    xmax=None,
    ymin=None,
    ymax=None,
    zmin=None,
    zmax=None,
    normalize_x=False,
    normalize_y=False,
    normalize_z=False,
    point_size=40,
    size_by=None,
    size_factor=1.0,
    alpha=0.7,
    elevation=None,
    azimuth=None,
    figsize=(10, 8),
    share_axes=True,
)
Input Object Types
| Object type | Accepted? | Notes |
|---|---|---|
Batch |
Yes | Main supported input. Uses summary tables, condition metadata, and figure paths. |
Experiment |
Yes | Works when it exposes the same summary and condition attributes. |
MiniExperiment |
Usually | Works after processing into a PyFLASH-like object with summary columns and conditions. |
pandas.DataFrame |
No | This wrapper does not call the raw DataFrame adapter. Use from_dataframe first if needed. |
Parameters
| Parameter | Type | Default | Meaning |
|---|---|---|---|
experiment |
PyFLASH-like object | required | Source object with .summary, .condition_list, and .fig_path. |
x, y, z |
str or list-like |
required | Summary columns for the 3D axes. List-like values queue all combinations. |
by |
str |
"conditions" |
Iteration level when factor is not set. Usually "conditions" or "all". |
factor |
str or None |
None |
Factor column to group by instead of full condition. |
filter_by |
dict, tuple, list, or None |
None |
Preferred row filter. Lists run queue mode. Legacy alias: specificity. |
roi |
str, list-like, or None |
None |
ROI-base selector. Multiple ROI bases run queue mode. |
save |
bool |
True |
Save figures under experiment.fig_path. |
combine |
bool |
False |
Overlay groups on one 3D axis and save one combined figure. |
x_range, y_range, z_range |
pair or None |
None |
Manual axis limits. |
xmin, xmax, ymin, ymax, zmin, zmax |
number or None |
None |
Lower/upper limit aliases merged into axis ranges. |
normalize_x, normalize_y, normalize_z |
bool, pair, or "Z-score" |
False |
Axis normalization mode. |
point_size |
number | 40 |
Baseline point area. |
size_by |
str or None |
None |
Numeric summary column used to scale point size. |
size_factor |
number | 1.0 |
Multiplier for point sizes. |
alpha |
number | 0.7 |
Point transparency. |
elevation, azimuth |
number or None |
None |
3D camera view angles. |
figsize |
tuple | (10, 8) |
Figure size in inches. |
share_axes |
bool |
True |
Share ranges across queued sibling combinations when the same column repeats. |
Returns
| Return value | Type | Meaning |
|---|---|---|
result |
dict |
Standard PyFLASH iterator result. Includes plotted scatter axes and group labels where data exist. |
result |
dict |
Queue mode returns dictionaries keyed by ROI, row filter, or (x, y, z) tuple. |
Saved Outputs
With save=True, figures are saved under a Scatter3D plot folder. Combined
figures include (Combined) in the file name. Separate figures include the
condition or factor value.
No statistics tables are written.
Examples
Plot one 3D relationship without saving
from PyFLASH.plotting import plot_scatter_3d

result = plot_scatter_3d(
    batch,
    x="GFAP_Count",
    y="Iba1_Count",
    z="DAPI_Volume",
    save=False,
)

print(result["group"])
Overlay all groups and scale by another metric
plot_scatter_3d(
    batch,
    x="GFAP_Count",
    y="Iba1_Count",
    z="DAPI_Volume",
    size_by="GFAP_IntDen",
    combine=True,
    elevation=25,
    azimuth=130,
    save=True,
)
Queue several column combinations
queued = plot_scatter_3d(
    batch,
    x=["GFAP_Count", "Iba1_Count"],
    y="DAPI_Volume",
    z=["GFAP_IntDen", "Iba1_IntDen"],
    share_axes=True,
    save=False,
)

print(queued.keys())
Notes
- All three axis columns are converted to numeric and rows with missing x/y/z values are dropped.
- Axis limits from
x_range,xmin, andxmaxare merged before plotting. - When normalization is enabled for an axis, experiment-level axis limits are not applied to that axis.
share_axes=Trueonly computes shared ranges for queued column combinations when x/y/z are not normalized.- The plot is describe-layer exempt because it is exploratory and does not compute an inferential statistic.