plot_multivariable_regression_matrix
Summary
plot_multivariable_regression_matrix draws heatmaps where each cell is a
joint regression model, such as outcome ~ predictor_1 + predictor_2. It is
registered as multivariable_regression_matrix.
Use it to compare many outcomes against named predictor sets while keeping the model results inspectable from Python.
Example figure
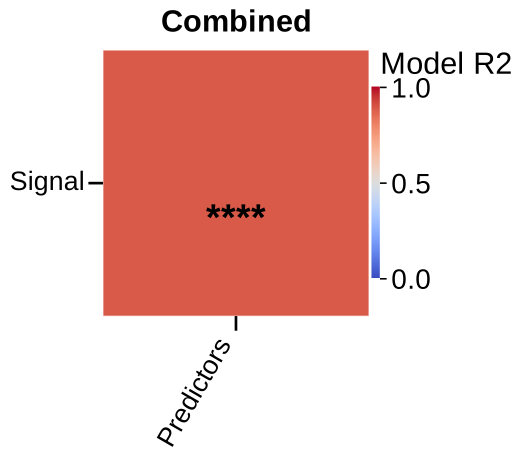
Joint regression of Signal on predictors x1+x2 (model R²). Rendered from the synthetic example dataset.
Signature
plot_multivariable_regression_matrix(experiment, filtered_columns=None, data_cols=None, predictors=None, by='conditions', factor=None, specificity=None, split_by=None, filter_by=None, roi=None, save=True, column_strings=None, regex_string=None, exclude='', data_col_contains=None, data_col_regex=None, data_col_exclude=None, min_n=None, value='r2', correction='fdr', alpha=0.05, tick_label_size=20, conditions=None, condition_col='Condition', factor_cols=None, animal_col='AnimalName', group_list=None, groups=None, group_col=None, group_cols=None, subject_col=None, dataframe_kwargs=None, combine_conditions=True, column_order=None, predictor_order=None, share_columns_across_panels=True, blank_panel_on_nan=False)
Input Object Types
| Object type | Accepted? | Notes |
|---|---|---|
Batch |
Yes | Main supported input. |
Experiment |
Yes | Works with .summary, .condition_list, and figure paths. |
MiniExperiment |
Yes | Works for summary-style data. |
pandas.DataFrame |
Yes | Wrapped internally; pass group_col and subject_col when needed. |
Parameters
| Parameter | Type | Default | Meaning |
|---|---|---|---|
experiment |
Batch, experiment-like object, or DataFrame |
required | Data source containing a summary table. |
data_cols / filtered_columns |
list-like or None |
None |
Outcome columns. If discovered broadly, predictor columns are removed from the outcome list. |
predictors |
mapping or iterable | required | Predictor-set definitions, usually {"label": ["col1", "col2"]}. |
by / split_by |
string | 'conditions' |
Panel by conditions, by "all", or by a factor. |
factor |
string or None |
None |
Explicit factor column for panels. |
filter_by / specificity |
mapping, tuple, list, or None |
None |
Row filter or filter queue. |
roi |
string, list, or None |
None |
Select one ROI summary or run an ROI queue. |
min_n |
int or None |
None |
Minimum complete rows per model. The effective minimum is at least number_of_predictors + 2. |
value |
string | 'r2' |
Heatmap value. Accepted values: 'r2', 'adj_r2', 'p', or 'q'. |
correction |
string | 'fdr' |
Star annotation basis: 'fdr' for q-values or 'none'/'p' for raw p-values. |
alpha |
float | 0.05 |
Threshold for star annotations. |
column_order, predictor_order |
list-like or None |
None |
Reorder outcome rows or predictor-set columns. |
share_columns_across_panels |
bool | True |
Keep only outcome/predictor combinations valid in every panel. |
blank_panel_on_nan |
bool | False |
Keep invalid cells as NaN instead of dropping empty axes. |
save |
bool | True |
Write one combined SVG figure. |
Returns
| Return value | Type | Meaning |
|---|---|---|
outputs |
dict |
One entry per condition, factor level, or "Combined" panel. |
outputs[panel]["models"] |
dict |
Model payloads keyed like "Signal ~ PairA". |
outputs[panel]["values"] |
pandas.DataFrame |
Heatmap values for the selected value. |
outputs[panel]["p_values"] |
pandas.DataFrame |
Raw model p-values. |
outputs[panel]["q_values"] |
pandas.DataFrame |
Benjamini-Hochberg q-values across the panel's tested cells. |
outputs[panel]["dropped_y"], outputs[panel]["dropped_predictors"] |
list |
Axes dropped because no valid model remained. |
Each model payload includes keys such as n, r2, adj_r2, f, p, q,
df_model, df_resid, coefficients, rank, rank_deficient,
predictor_set, and predictors.
Saved Outputs
With save=True, PyFLASH writes one SVG figure below the input object's figure
folder, usually in:
The filename begins with Multivariable Regression Matrix and includes the
panel names plus any filter, factor, or ROI suffix. The standalone plot does
not write model CSVs; use the returned outputs dictionary for model tables.
Examples
Minimal model matrix:
from PyFLASH.plotting import plot_multivariable_regression_matrix

out = plot_multivariable_regression_matrix(
    batch,
    data_cols=["GFAP_Count", "Iba1_Count"],
    predictors={"Age model": ["Age", "AgeSquared"]},
    split_by="all",
    save=False,
)
Raw DataFrame with two predictor sets:
out = plot_multivariable_regression_matrix(
    df,
    data_cols=["Signal", "Noise"],
    predictors={"PairA": ["x1", "x2"], "PairB": ["z1", "z2"]},
    group_col="Diagnosis",
    subject_col="AnimalName",
    split_by="all",
    value="q",
    save=False,
)
Inspect a model:
model = out["Combined"]["models"]["Signal ~ PairA"]
print(model["r2"], model["q"], model["coefficients"])
Notes
Predictor sets are validated against the active summary table. Missing
predictor names raise a ValueError, and duplicate predictor-set labels are not
allowed.
The model is an ordinary least-squares fit using a numeric design matrix with an
intercept. Non-numeric, excluded, and missing rows are dropped per model.
Rank-deficient designs are reported through rank_deficient rather than hidden.
This registry entry is describe-layer covered: when PyFLASH.report is
active, each valid model emits a structured multivariable regression record.