plot_radar
Summary
plot_radar draws radar, or spider, plots across three or more numeric summary
columns. It can plot one polygon per condition or factor, overlay all groups on
one polar axis, show contributing subject markers, and normalize columns to a
shared scale.
Registry name: radar.
Example figure
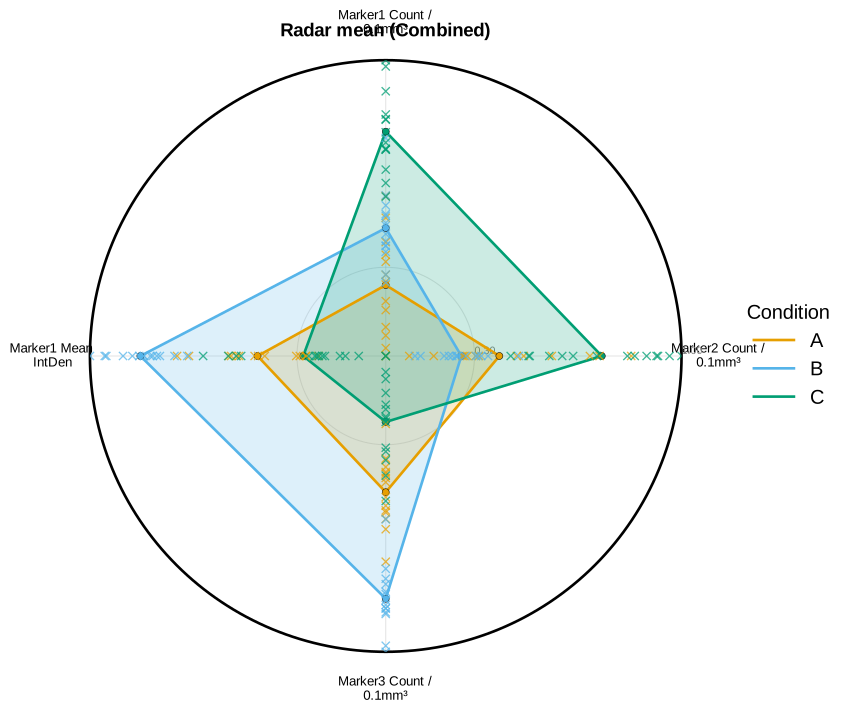
Marker-profile radar for groups A/B/C. Rendered from the synthetic example dataset.
Signature
plot_radar(
    experiment,
    filtered_columns=None,
    data_cols=None,
    by="conditions",
    factor=None,
    split_by=None,
    specificity=None,
    filter_by=None,
    roi=None,
    save=True,
    combine=False,
    column_strings=None,
    regex_string=None,
    exclude="",
    data_col_contains=None,
    data_col_regex=None,
    data_col_exclude=None,
    statistic="mean",
    normalize=True,
    share_scale=True,
    share_columns_across_panels=True,
    fill=True,
    alpha=0.20,
    line_width=2.0,
    point_size=28,
    tick_label_size=10,
    label_wrap=18,
    include_N=False,
    show_animal_xs=True,
    animal_x_marker="x",
    animal_x_size=38,
    animal_x_alpha=0.75,
    animal_x_color=None,
    show_subject_points=None,
    subject_point_marker=None,
    subject_point_size=None,
    subject_point_alpha=None,
    subject_point_color=None,
    radial_value_radii=(0.30, 1.00),
    radial_value_color="grey",
    radial_value_size=None,
    figsize=(8, 8),
    auto_style=True,
    style_cycle=None,
    conditions=None,
    condition_col="Condition",
    factor_cols=None,
    animal_col="AnimalName",
    group_list=None,
    groups=None,
    group_col=None,
    group_cols=None,
    subject_col=None,
    dataframe_kwargs=None,
)
Input Object Types
| Object type | Accepted? | Notes |
|---|---|---|
Batch |
Yes | Main supported input. Uses .summary or ROI-specific .summaries. |
Experiment |
Yes | Works when summary and condition metadata are present. |
MiniExperiment |
Yes | Works after processing into a summary-style object. |
pandas.DataFrame |
Yes | Wrapped with from_dataframe; provide group_col, group_cols, or group_list. |
Parameters
| Parameter | Type | Default | Meaning |
|---|---|---|---|
experiment |
PyFLASH-like object or DataFrame |
required | Summary data source. |
data_cols |
list-like or None |
None |
Preferred exact columns for radar axes. Legacy alias: filtered_columns. |
data_col_contains |
str, list-like, or None |
None |
Include columns containing text. Legacy alias: column_strings. |
data_col_regex |
str, list-like, or None |
None |
Include columns matching regex. Legacy alias: regex_string. |
data_col_exclude |
str, list-like, or None |
None |
Exclude matching columns. Legacy alias: exclude. |
split_by |
str or None |
None |
Preferred grouping mode. Legacy alias: factor or by. |
filter_by |
dict, tuple, list, or None |
None |
Preferred row filter. Legacy alias: specificity. |
roi |
str, list-like, or None |
None |
ROI-base selector. Multiple ROI bases run queue mode. |
save |
bool |
True |
Save radar figures under experiment.fig_path. |
combine |
bool |
False |
Overlay all groups on one radar axis. |
statistic |
str or callable |
"mean" |
Summary per axis. Built-ins include "mean", "median", "sum", "min", and "max". |
normalize |
bool |
True |
Normalize each column to a 0 to 1 scale before plotting. |
share_scale |
bool |
True |
Use one per-column scale across queued sibling radar plots. |
share_columns_across_panels |
bool |
True |
Use the same resolved column set for each panel. |
fill |
bool |
True |
Fill radar polygons as well as drawing outlines. |
alpha |
number | 0.20 |
Fill transparency. |
line_width |
number | 2.0 |
Polygon outline width. |
point_size |
number | 28 |
Vertex marker size. |
tick_label_size |
number | 10 |
Axis label size. |
label_wrap |
int |
18 |
Wrap long axis labels at this width. Use 0 to disable wrapping. |
include_N |
bool |
False |
Add contributing subject count to labels. |
show_subject_points |
bool or None |
None |
Preferred alias for showing subject-level markers. |
show_animal_xs |
bool |
True |
Legacy name for subject-level markers. |
subject_point_marker, subject_point_size, subject_point_alpha, subject_point_color |
style values | None |
Preferred aliases for subject marker styling. |
radial_value_radii |
tuple or None |
(0.30, 1.00) |
Radial fractions to label with values. None hides labels. |
figsize |
tuple | (8, 8) |
Figure size in inches. |
auto_style, style_cycle |
style controls | True, None |
Control hatch/fill styles for groups sharing colours. |
group_col, group_cols, subject_col, group_list, dataframe_kwargs |
raw DataFrame controls | varies | Used only when experiment is a raw pandas.DataFrame. |
Returns
| Return value | Type | Meaning |
|---|---|---|
result |
dict |
Standard PyFLASH iterator result. Keys include radar, group, the compatibility subject-count key n_animals, values, raw_values, and animal_values. |
result |
dict |
ROI or filter-queue mode returns dictionaries keyed by ROI or filter value. |
Saved Outputs
With save=True, figures are saved under a Radar plot folder. Combined mode
saves one Radar <statistic> Combined... figure. Separate mode saves one
Radar <statistic> <group>... figure per condition or factor value.
No statistics tables are written.
Examples
Plot explicit columns from a Batch
from PyFLASH.plotting import plot_radar

result = plot_radar(
    batch,
    data_cols=["GFAP_Count", "Iba1_Count", "DAPI_Volume"],
    combine=True,
    save=False,
)

print(result["group"])
Plot one factor and include subject markers
plot_radar(
    batch,
    data_col_contains=["Count", "Volume"],
    split_by="Diagnosis",
    show_subject_points=True,
    include_N=True,
    save=True,
)
Use a raw DataFrame
result = plot_radar(
    df,
    data_cols=["GFAP_Count", "Iba1_Count", "DAPI_Volume"],
    group_col="Diagnosis",
    subject_col="SubjectID",
    save=False,
)

print(result["values"])
Notes
- At least three numeric columns must remain after filtering, or the function
raises
ValueError. - Sentinel values such as
NOT_INCLUDED_IN_EXPERIMENTare treated as missing during numeric conversion. - With
normalize=True, constant columns map to the middle of the radial scale. - Filter queues share normalization references when
share_scale=True, so sibling plots remain comparable. animal_valuesin the result contains per-subject radar values when subject markers are enabled.