plot_rect_matrices
Summary
plot_rect_matrices draws rectangular correlation heatmaps where one set of
columns is placed on the Y axis and a second set is placed on the X axis. It is
registered as rect_matrices.
Use it when the two sides of the question differ, such as marker columns against behavior, age, batch metrics, or covariates.
Example figure
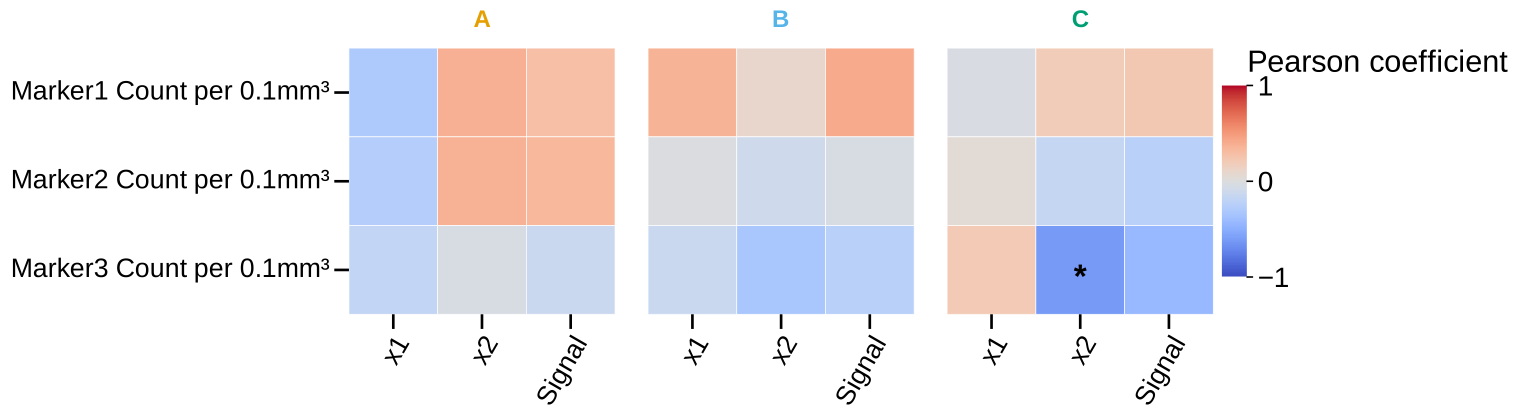
Rectangular correlation heatmap: marker counts (rows) vs x1/x2/Signal (columns). Rendered from the synthetic example dataset.
Signature
plot_rect_matrices(experiment, filtered_columns=None, data_cols=None, against_columns=None, against_data_cols=None, by='conditions', factor=None, specificity=None, split_by=None, filter_by=None, roi=None, save=True, correlation='pearsonr', tick_label_size=20, column_strings=None, regex_string=None, exclude='', data_col_contains=None, data_col_regex=None, data_col_exclude=None, against_column_strings=None, against_regex_string=None, against_exclude='', against_data_col_contains=None, against_data_col_regex=None, against_data_col_exclude=None, conditions=None, condition_col='Condition', factor_cols=None, animal_col='AnimalName', group_list=None, groups=None, group_col=None, group_cols=None, subject_col=None, dataframe_kwargs=None, encode_x_categorical=True, combine_conditions=True, column_order=None, against_order=None, share_columns_across_panels=True, blank_panel_on_nan=False, triangle=None, show_diagonal=True, show_values=False, value_format='.2f')
Input Object Types
| Object type | Accepted? | Notes |
|---|---|---|
Batch |
Yes | Main supported input. |
Experiment |
Yes | Works with .summary, .condition_list, and figure paths. |
MiniExperiment |
Yes | Works for summary-style data. |
pandas.DataFrame |
Yes | Wrapped internally; pass group_col and subject_col when needed. |
Parameters
| Parameter | Type | Default | Meaning |
|---|---|---|---|
experiment |
Batch, experiment-like object, or DataFrame |
required | Data source containing a summary table. |
data_cols / filtered_columns |
list-like or None |
None |
Y-axis columns. |
against_data_cols / against_columns |
list-like or None |
None |
X-axis columns. |
data_col_contains, data_col_regex, data_col_exclude |
string/list filters | None, None, None |
Discover Y-axis columns. |
against_data_col_contains, against_data_col_regex, against_data_col_exclude |
string/list filters | None, None, None |
Discover X-axis columns. |
by / split_by |
string | 'conditions' |
Panel by conditions, by "all", or by a factor. |
factor |
string or None |
None |
Explicit factor column for panels. |
correlation |
string | 'pearsonr' |
Pearson, Spearman, Kendall, or aliases p, s, k. |
encode_x_categorical |
bool | True |
Encode non-numeric X columns when possible so categorical covariates can be correlated. |
column_order, against_order |
list-like or None |
None |
Apply requested order to Y and X axes. |
share_columns_across_panels |
bool | True |
Keep a shared valid Y/X set across panels. |
blank_panel_on_nan |
bool | False |
Keep requested axes and mark invalid cells as NaN instead of dropping axes. |
triangle, show_diagonal, show_values, value_format |
display options | None, True, False, '.2f' |
Compact matrix rendering controls. |
filter_by / specificity |
mapping, tuple, list, or None |
None |
Row filter or filter queue. |
roi |
string, list, or None |
None |
Select one ROI summary or run an ROI queue. |
save |
bool | True |
Write the combined heatmap figure to disk. |
Returns
| Return value | Type | Meaning |
|---|---|---|
outputs |
dict |
One entry per condition, factor level, or "Combined" panel. |
outputs[panel]["correlations"] |
dict |
Pair labels such as "GFAP_Count vs Age" mapped to (p_value, coefficient). |
outputs[panel]["dropped_y"] |
list |
Y columns dropped for that panel or globally. |
outputs[panel]["dropped_x"] |
list |
X columns dropped for that panel or globally. |
Saved Outputs
With save=True, PyFLASH writes one SVG figure below the input object's figure
folder, usually in Rectangular/Matrices/. The filename starts with
Rectangular <method> Correlation Matrix and includes panel names plus any
filter, factor, or ROI suffix.
No CSV table is written by this standalone plot. Use the returned dictionary or the correlation pipelines when you need saved matrices.
Examples
Minimal rectangular heatmap:
from PyFLASH.plotting import plot_rect_matrices

rect = plot_rect_matrices(
    batch,
    data_cols=["GFAP_Count", "Iba1_Count"],
    against_data_cols=["Age"],
    split_by="all",
    save=False,
)
Keep requested cells visible and label values:
rect = plot_rect_matrices(
    batch,
    data_col_contains=["_Count"],
    against_data_cols=["Age", "BehaviourScore"],
    split_by="Diagnosis",
    blank_panel_on_nan=True,
    show_values=True,
    value_format=".3f",
    save=False,
)
Inspect dropped columns and one result:
panel = rect["Combined"]
print(panel["dropped_y"], panel["dropped_x"])
print(panel["correlations"]["GFAP_Count vs Age"])
Notes
The function computes each Y/X cell after dropping incomplete rows for that pair. A cell needs more than one complete pair to receive a coefficient and p-value.
blank_panel_on_nan=True is useful for publication layouts where every panel
must keep the same requested row and column labels, even if some cells are not
estimable.
The registry entry is describe-layer unreviewed. It returns numeric
correlation values, but it does not yet emit structured report records.