plot_mean_bars
Summary
plot_mean_bars draws one bar chart per selected summary column. Bars show
group means, optional points show individual observations, and statistical
comparisons can be annotated. Registry name: mean_bars.
Use it for first-pass group comparisons and publication-style summary plots.
Example figure
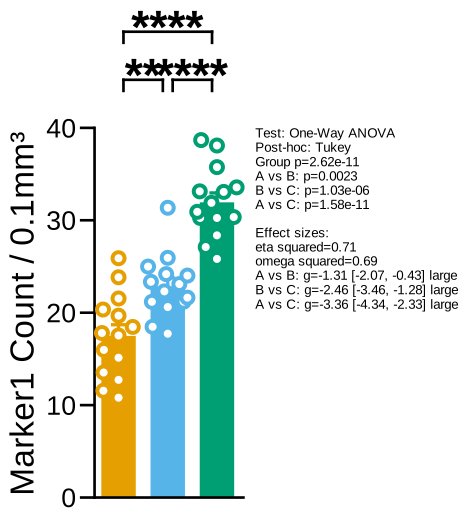
Marker1_Count across groups A/B/C with individual points and pairwise tests. Rendered from the synthetic example dataset.
Signature
plot_mean_bars(
    experiment,
    filtered_columns=None,
    data_cols=None,
    points=True,
    normalize=False,
    point_fill="white",
    point_edge="group",
    point_size=9,
    point_linewidth=3,
    specificity=None,
    filter_by=None,
    roi=None,
    comparisons=None,
    force_nonparametric=False,
    ns="ns",
    posthoc="Conover",
    posthoc_correction="auto",
    multiple_comparison="One-Way",
    bottom_ticks=False,
    bottom_tick_labels=False,
    factor=None,
    split_by=None,
    save=True,
    column_strings=None,
    regex_string=None,
    exclude="",
    data_col_contains=None,
    data_col_regex=None,
    data_col_exclude=None,
    save_normality=True,
    normality_dpi=96,
    auto_style=True,
    style_cycle=None,
    legend=False,
    dry_run=False,
)
Input Object Types
| Object type | Accepted? | Notes |
|---|---|---|
Batch |
Yes | Main supported input. Uses summary, condition_list, and fig_path. |
Experiment |
Yes | Works when it exposes the same summary and condition attributes. |
MiniExperiment |
Usually | Works for summary-style data when required columns exist. |
pandas.DataFrame |
Yes | Provide group_col=... or group_cols=...; the function wraps it with from_dataframe internally. |
Parameters
| Parameter | Type | Default | Meaning |
|---|---|---|---|
experiment |
Batch, Experiment, or MiniExperiment |
required | Data source to plot. |
data_cols |
list-like or None |
None |
Exact data columns to plot. Legacy alias: filtered_columns. |
data_col_contains |
list-like, str, or None |
None |
Include columns whose names contain these strings. Legacy alias: column_strings. |
data_col_regex |
str or list-like |
None |
Include columns matching one or more regular expressions. Legacy alias: regex_string. |
data_col_exclude |
str or list-like |
None |
Exclude columns whose names contain these strings. Legacy alias: exclude (which defaults to ""). |
points |
bool |
True |
Overlay individual observations on bars. |
normalize |
bool |
False |
Normalize values before plotting. |
filter_by |
dict, tuple, list, or None |
None |
Row filter such as {"Time": "WeekEight"}. Legacy alias: specificity. |
roi |
str, list-like, or None |
None |
ROI-base selector. Multiple ROI bases run queue mode. |
comparisons |
list-like or None |
None |
Comparison pairs. None uses planned comparisons from the group list when available. |
force_nonparametric |
bool |
False |
Force nonparametric tests even if normality checks pass. |
posthoc |
str |
"Conover" |
Post-hoc test for multi-group comparisons. |
posthoc_correction |
str |
"auto" |
Multiple-testing correction for post-hoc comparisons. |
multiple_comparison |
str |
"One-Way" |
Overall comparison mode. |
split_by |
str or None |
None |
Group by a specific group column instead of full groups. Legacy alias: factor. |
save |
bool |
True |
Save figures under experiment.fig_path. |
save_normality |
bool |
True |
Save normality check outputs when applicable. |
auto_style |
bool |
True |
Automatically vary bar styles when groups share colors. |
legend |
bool |
False |
Add a legend. |
dry_run |
bool |
False |
Compute statistics but skip figure creation and saving. |
group_list |
groupList or None |
None |
Optional group metadata when passing a raw DataFrame. Legacy alias: conditions. |
group_col |
str |
"Condition" |
Group column used when passing a raw DataFrame. Legacy alias: condition_col. |
group_cols |
list-like or None |
None |
Group columns used to infer crossed groups from a raw DataFrame. Legacy alias: factor_cols. |
subject_col |
str |
"AnimalName" |
Subject/sample/animal ID column used when passing a raw DataFrame. Legacy alias: animal_col. |
dataframe_kwargs |
dict or None |
None |
Advanced from_dataframe options such as colors, labels, ordering, and output paths. |
Returns
| Return value | Type | Meaning |
|---|---|---|
| result | function-dependent | Normal plotting mode follows the package plotting wrapper convention. |
| result | dict |
Queue mode returns a dictionary keyed by filter or ROI value. |
| stats | pandas.DataFrame |
With dry_run=True, returns computed statistics without creating figures. |
Saved Outputs
When save=True, the function saves one figure per selected column under the
input object's figure folder. It uses PyFLASH's standard plot subfolder naming,
including marker, split, filter, and ROI suffixes when relevant.
When save_normality=True, normality-check outputs may also be saved.
Examples
Plot explicit columns
from PyFLASH.plotting import plot_mean_bars

plot_mean_bars(
    batch,
    data_cols=["GFAP Volume", "Iba1 Count"],
    save=True,
)
Discover columns by text
plot_mean_bars(
    batch,
    data_col_contains=["Volume", "Count"],
    data_col_exclude="NonColoc",
    save=True,
)
Plot a raw DataFrame directly
plot_mean_bars(
    df,
    data_cols=["GFAP Volume"],
    group_col="Diagnosis",
    subject_col="Subject ID",
    save=False,
)
Group by one factor in a crossed design
plot_mean_bars(
    batch,
    data_col_contains="GFAP",
    split_by="Diagnosis",
    comparisons=[("Control", "AD")],
)
Compute statistics without writing figures
stats = plot_mean_bars(
    batch,
    data_col_contains="GFAP",
    dry_run=True,
    save=False,
)

print(stats.head())
Notes
- Prefer
data_colswhen you know the exact columns. Usedata_col_contains,data_col_regex, anddata_col_excludefor exploratory selection. filter_byfilters rows before plotting. For example,{"Time": "WeekEight"}limits the plot to rows where theTimecolumn isWeekEight.auto_style=Trueis important for crossed designs where groups may share a color but need distinct fills or hatches.dry_run=Trueis useful for checking tests and p-values before spending time rendering figures.