plot_volcano
Summary
plot_volcano draws group-vs-control screening plots across many numeric
columns. It is registered as volcano.
Each point is one selected column. The X axis is signed log-scaled percent
change versus the control group, and the Y axis is -log10(p-value).
Example figure
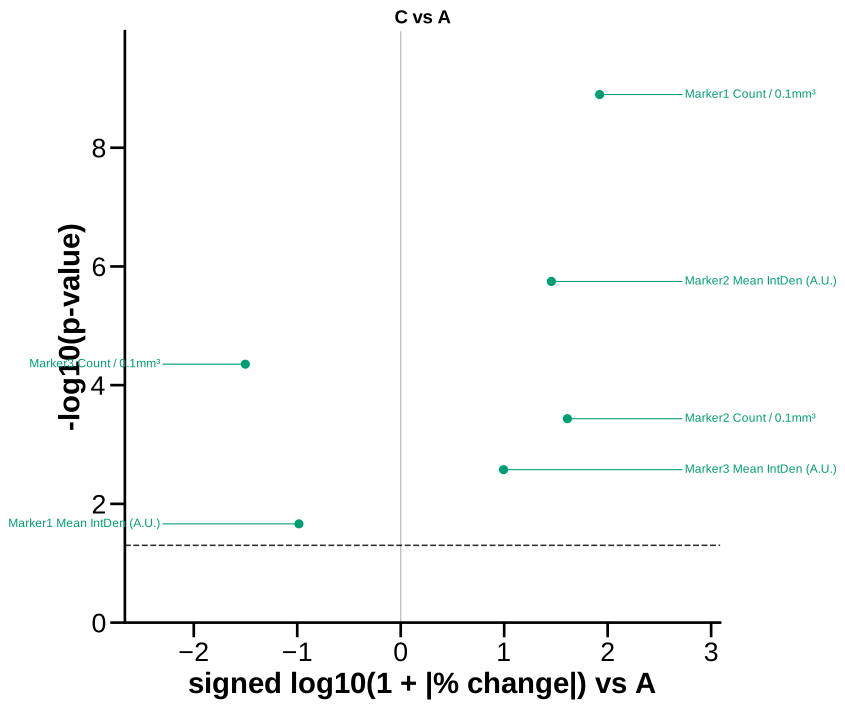
Group C vs control A: signed % change vs −log10 p across markers. Rendered from the synthetic example dataset.
Signature
plot_volcano(experiment, filtered_columns=None, data_cols=None, by='conditions', factor=None, split_by=None, control=None, specificity=None, filter_by=None, roi=None, force_nonparametric=False, p_threshold=0.05, label_points='significant', save=True, column_strings=None, regex_string=None, exclude='', data_col_contains=None, data_col_regex=None, data_col_exclude=None, conditions=None, condition_col='Condition', factor_cols=None, animal_col='AnimalName', group_list=None, groups=None, group_col=None, group_cols=None, subject_col=None, dataframe_kwargs=None)
Input Object Types
| Object type | Accepted? | Notes |
|---|---|---|
Batch |
Yes | Main supported input. |
Experiment |
Yes | Works with .summary, .condition_list, and figure paths. |
MiniExperiment |
Yes | Works for summary-style data. |
pandas.DataFrame |
Yes | Wrapped internally; pass group_col and subject_col when needed. |
Parameters
| Parameter | Type | Default | Meaning |
|---|---|---|---|
experiment |
Batch, experiment-like object, or DataFrame |
required | Data source containing a summary table. |
data_cols / filtered_columns |
list-like or None |
None |
Numeric columns to screen. |
data_col_contains, data_col_regex, data_col_exclude |
string/list filters | None, None, None |
Discover screened columns. |
by / split_by |
string | 'conditions' |
Group by conditions or by a factor-style column. |
factor |
string or None |
None |
Explicit factor column for group-vs-control panels. |
control |
string or None |
None |
Reference group. If omitted, PyFLASH uses the first available group. |
force_nonparametric |
bool | False |
Force Mann-Whitney U instead of the normality-selected two-group path. |
p_threshold |
float | 0.05 |
Horizontal significance threshold. Must be between 0 and 1. |
label_points |
string or None |
'significant' |
Accepted values include 'significant', 'non-significant', 'both', and 'none'. |
filter_by / specificity |
mapping, tuple, list, or None |
None |
Row filter or filter queue. |
roi |
string, list, or None |
None |
Select one ROI summary or run an ROI queue. |
save |
bool | True |
Write SVG figures to disk. |
group_col, group_cols, subject_col |
strings/list or None |
None |
DataFrame-adapter grouping and subject columns. |
Returns
| Return value | Type | Meaning |
|---|---|---|
result |
dict |
Plot-run output keyed by group, factor level, ROI, or filter item depending on the call. |
leaf result |
dict |
Contains group and n_points, the number of plotted comparable columns. |
The function does not return the full per-column volcano table. Use the plot or run a group-comparison pipeline when you need saved per-marker statistics.
Saved Outputs
With save=True, PyFLASH writes one SVG per non-control group below the input
object's figure folder in Volcano/. Filenames follow:
The control group panel is treated as a reference and is not saved. Groups with no comparable numeric data are skipped.
If global HTML export is enabled, the function also attempts an HTML volcano export in the same figure subfolder.
Examples
Minimal volcano screen:
from PyFLASH.plotting import plot_volcano

plots = plot_volcano(
    batch,
    data_cols=["GFAP_Count", "Iba1_Count", "NeuN_Count"],
    control="Control",
    save=False,
)
Discover marker families and label all points:
plots = plot_volcano(
    df,
    data_col_contains=["_Count", "_VolumeTotal"],
    data_col_exclude=["Raw"],
    group_col="Diagnosis",
    subject_col="AnimalName",
    control="Control",
    label_points="both",
    force_nonparametric=True,
    save=False,
)
Inspect plotted point counts:
Notes
The two-group p-value path mirrors the two-group logic used by the shared bar
statistics engine: with enough data and normality it uses an independent t-test;
otherwise it uses Mann-Whitney U. force_nonparametric=True always uses the
non-parametric path.
Percent change cannot be computed when the control mean is zero and the group mean is non-zero, so those columns are skipped.
This is a screening visualization. It does not apply FDR correction and is
currently describe-layer unreviewed. For saved effect-size and multiple
testing tables, use group_comparison.