plot_ecdf
Summary
plot_ecdf draws empirical cumulative distribution curves for marker-level
values. It is registered as ecdf in PyFLASH.spec.PLOT_REGISTRY.
Use it when you want to compare distributions without choosing histogram bins.
Example figure
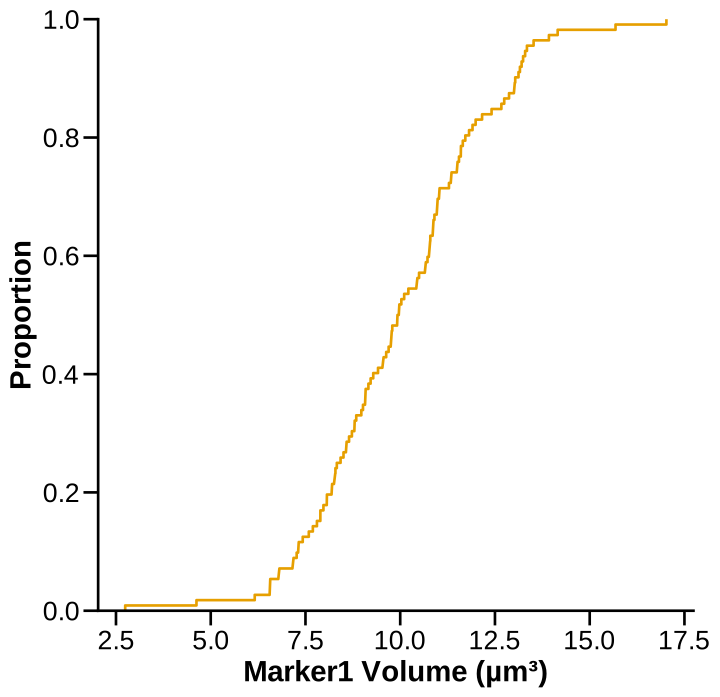
Marker1 volume empirical CDF (group A). Rendered from the synthetic example dataset.
Signature
plot_ecdf(
    experiment,
    marker,
    x_attr,
    by="conditions",
    factor=None,
    line_width=2.0,
    alpha=1.0,
    stat="proportion",
    complementary=False,
    save=True,
    specificity=None,
    filter_by=None,
    roi=None,
    bottom_ticks=True,
    bottom_tick_labels=True,
    x_range=None,
    xmin=None,
    xmax=None,
    share_axes=True,
)
Input Object Types
| Object type | Accepted? | Notes |
|---|---|---|
Batch |
Yes | Main supported input when marker tables were imported. |
Experiment |
Yes | Must expose data[marker].df, condition_list, summary, and fig_path. |
MiniExperiment |
Only if marker tables exist | A summary-only mini experiment is not enough. |
pandas.DataFrame |
No direct raw table mode | Wrap raw tables with from_dataframe(..., data=...) first so the marker table exists. |
Parameters
| Parameter | Type | Default | Meaning |
|---|---|---|---|
experiment |
Batch or Experiment |
required | Data source containing marker tables. |
marker |
str or list-like |
required | Marker table key. List-like values queue plots. |
x_attr |
str or list-like |
required | Attribute to plot. May be a full marker-table column or marker suffix. List-like values queue plots. |
by |
str |
"conditions" |
Iteration level. Common value: "conditions". |
factor |
str or None |
None |
Group by factor values instead of conditions. |
line_width |
number | 2.0 |
Width of each ECDF line. |
alpha |
number | 1.0 |
Line transparency, clamped between 0 and 1. |
stat |
str |
"proportion" |
Y-axis scale. Accepted values: "proportion" or "count". |
complementary |
bool |
False |
Plot the complementary ECDF, useful for upper-tail comparisons. |
save |
bool |
True |
Save SVG figures under the input object's figure folder. |
filter_by |
dict, tuple, queue, or None |
None |
Preferred row filter applied before plotting. A queue returns a dictionary keyed by filter. Legacy alias: specificity. |
roi |
str, list-like, or None |
None |
ROI-base selector. Multiple ROI bases run queue mode. |
bottom_ticks |
bool |
True |
Show bottom-axis tick marks. |
bottom_tick_labels |
bool |
True |
Show bottom-axis tick labels. |
x_range |
(min, max) or None |
None |
Explicit x-axis range. |
xmin, xmax |
number or None |
None |
Convenience aliases for lower/upper values in x_range. |
share_axes |
bool |
True |
Use registered axis limits when available and no explicit range is supplied. |
Returns
| Return value | Type | Meaning |
|---|---|---|
| result | dict |
Shared runner output. Keys commonly include group and n lists. |
| queued result | dict |
When marker, x_attr, filter_by, or roi is queued, returns nested dictionaries keyed by the queued values. |
The return value records processed groups and row counts. It is not a persistent figure handle.
Saved Outputs
When save=True, figures are written below experiment.fig_path in an ECDFs
subfolder, with marker, factor, row-filter, and ROI suffixes when relevant.
Common filename:
Examples
Plot an ECDF by condition
from PyFLASH.plotting import plot_ecdf

result = plot_ecdf(
    batch,
    marker="GFAP",
    x_attr="Volume",
    save=False,
)

print(result.get("group"))
Plot counts instead of proportions
Plot upper-tail behaviour
Queue markers
queued = plot_ecdf(
    batch,
    marker=["GFAP", "Iba1"],
    x_attr="Volume",
    save=False,
)

for key, value in queued.items():
    print(key, value.get("n"))
Notes
statis validated and must be"proportion"or"count".- Empty groups draw a "No data available" placeholder for that group.
ecdfis describe-layer exempt: it is a descriptive distribution plot and does not emit structured inferential report records.