plot_ridgeline
Summary
plot_ridgeline draws stacked density curves for a marker-level attribute,
grouped by condition or factor. It is registered as ridgeline in
PyFLASH.spec.PLOT_REGISTRY.
Use it when you want to compare the shapes of several distributions in one compact figure.
Example figure
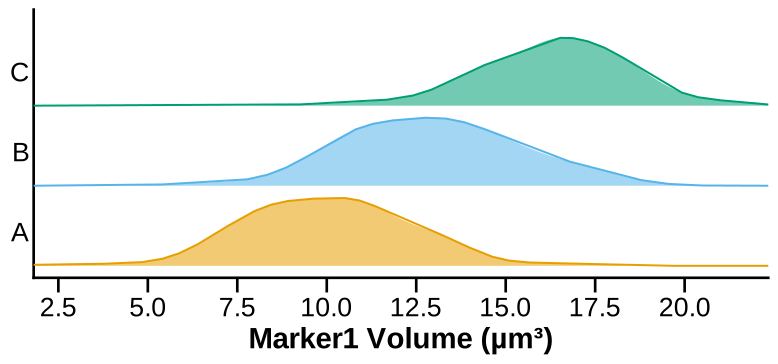
Marker1 volume density ridges per group. Rendered from the synthetic example dataset.
Signature
plot_ridgeline(
    experiment,
    marker,
    x_attr,
    by="conditions",
    factor=None,
    ridge_height=0.85,
    alpha=0.55,
    line_width=1.5,
    bw_adjust=1.0,
    save=True,
    specificity=None,
    filter_by=None,
    roi=None,
    bottom_ticks=True,
    bottom_tick_labels=True,
    x_range=None,
    xmin=None,
    xmax=None,
    share_axes=True,
)
Input Object Types
| Object type | Accepted? | Notes |
|---|---|---|
Batch |
Yes | Main supported input when marker tables were imported. |
Experiment |
Yes | Must expose data[marker].df, condition_list, summary, and fig_path. |
MiniExperiment |
Only if marker tables exist | A summary-only mini experiment is not enough. |
pandas.DataFrame |
No direct raw table mode | Wrap raw tables with from_dataframe(..., data=...) first so the marker table exists. |
Parameters
| Parameter | Type | Default | Meaning |
|---|---|---|---|
experiment |
Batch or Experiment |
required | Data source containing marker tables. |
marker |
str or list-like |
required | Marker table key. List-like values queue plots. |
x_attr |
str or list-like |
required | Attribute to plot. May be a full marker-table column or marker suffix. List-like values queue plots. |
by |
str |
"conditions" |
Iteration level. Common value: "conditions". |
factor |
str or None |
None |
Group by factor values instead of conditions. |
ridge_height |
number | 0.85 |
Vertical height for each density ridge. Values are clamped to at least 0.05. |
alpha |
number | 0.55 |
Fill transparency, clamped between 0 and 1. |
line_width |
number | 1.5 |
Outline width for each density curve. |
bw_adjust |
number | 1.0 |
Kernel-density bandwidth multiplier. Larger values smooth more. |
save |
bool |
True |
Save the SVG figure under the input object's figure folder. |
filter_by |
dict, tuple, queue, or None |
None |
Preferred row filter applied before plotting. A queue returns a dictionary keyed by filter. Legacy alias: specificity. |
roi |
str, list-like, or None |
None |
ROI-base selector. Multiple ROI bases run queue mode. |
bottom_ticks |
bool |
True |
Show bottom-axis tick marks. |
bottom_tick_labels |
bool |
True |
Show bottom-axis tick labels. |
x_range |
(min, max) or None |
None |
Explicit x-axis range. |
xmin, xmax |
number or None |
None |
Convenience aliases for lower/upper values in x_range. |
share_axes |
bool |
True |
Use registered axis limits when available and no explicit range is supplied. |
Returns
| Return value | Type | Meaning |
|---|---|---|
| result | dict |
Shared runner output. Keys commonly include group and n lists. |
| queued result | dict |
When marker, x_attr, filter_by, or roi is queued, returns nested dictionaries keyed by the queued values. |
The return value records processed groups and row counts. It is not a persistent figure handle.
Saved Outputs
When save=True, one SVG figure is written below experiment.fig_path in a
Ridgelines subfolder, with marker, factor, row-filter, and ROI suffixes when
relevant.
Common filename:
Examples
Plot one ridgeline figure
from PyFLASH.plotting import plot_ridgeline

result = plot_ridgeline(
    batch,
    marker="GFAP",
    x_attr="Volume",
    save=False,
)

print(result.get("n"))
Adjust smoothing and range
Group by a factor
Inspect queued output
queued = plot_ridgeline(
    batch,
    marker=["GFAP", "Iba1"],
    x_attr="Volume",
    save=False,
)

for key, value in queued.items():
    print(key, value.get("group"))
Notes
- A ridgeline requires at least one finite numeric value after filtering.
- Increase
bw_adjustfor smoother curves and decrease it to reveal sharper local structure. ridgelineis describe-layer exempt: it is a descriptive distribution plot and does not emit structured inferential report records.