plot_matrices
Summary
plot_matrices draws square correlation heatmaps for selected numeric columns.
It is registered as matrices in PyFLASH.spec.PLOT_REGISTRY.
Use it for a quick visual overview of pairwise marker or summary-column relationships within each condition, factor level, or pooled group.
Example figure
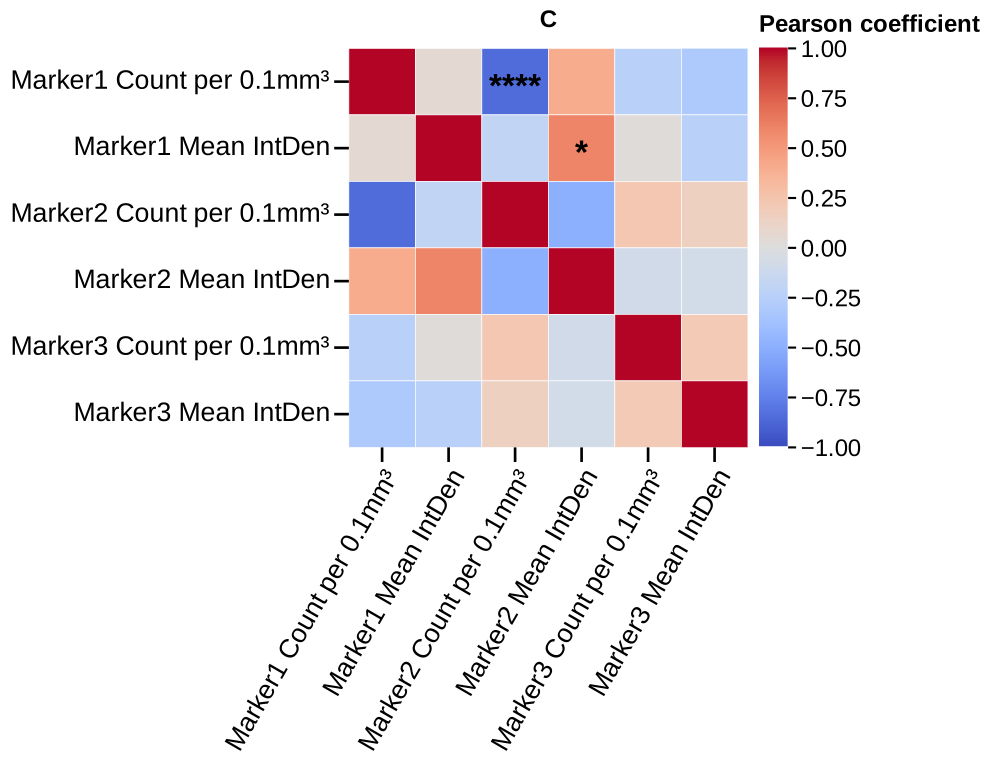
All-vs-all Pearson correlation matrix of the six marker metrics (group A). Rendered from the synthetic example dataset.
Signature
plot_matrices(experiment, filtered_columns=None, data_cols=None, by='conditions', factor=None, split_by=None, correlation='pearsonr', first_columns=None, tick_label_size=20, leading_data_cols=None, marker=None, specificity=None, filter_by=None, roi=None, save=True, column_strings=None, regex_string=None, exclude='', data_col_contains=None, data_col_regex=None, data_col_exclude=None, prefix_order=None, marker_order=None, share_columns_across_panels=True, triangle=None, show_diagonal=True, show_values=False, value_format='.2f', conditions=None, condition_col='Condition', factor_cols=None, animal_col='AnimalName', group_list=None, groups=None, group_col=None, group_cols=None, subject_col=None, dataframe_kwargs=None)
Input Object Types
| Object type | Accepted? | Notes |
|---|---|---|
Batch |
Yes | Main supported input. Reads batch.summary; roi can select from ROI summaries. |
Experiment |
Yes | Works when the object exposes .summary, .condition_list, and figure paths. |
MiniExperiment |
Yes | Works for summary-style imported data when required columns exist. |
pandas.DataFrame |
Yes | Wrapped internally; pass group_col and subject_col when the table is not already PyFLASH-shaped. |
Parameters
| Parameter | Type | Default | Meaning |
|---|---|---|---|
experiment |
Batch, experiment-like object, or DataFrame |
required | Data source containing a subject-level summary table. |
data_cols |
list-like or None |
None |
Exact numeric columns for the matrix. filtered_columns remains supported for older code. |
data_col_contains, data_col_regex, data_col_exclude |
string/list filters | None, None, None |
Discover columns by substring, regular expression, and exclusion token. |
by / split_by |
string | 'conditions' |
Panel by conditions, by "all", or by a factor-style column. |
factor |
string or None |
None |
Explicit factor column for factor-level panels. |
correlation |
string | 'pearsonr' |
Accepted values: Pearson, Spearman, Kendall, or aliases p, s, k. |
first_columns / leading_data_cols |
list-like or None |
None |
Pin selected columns at the start of the matrix before sorting the rest. |
marker |
string or None |
None |
Read a marker-level table instead of summary. |
filter_by / specificity |
mapping, tuple, list, or None |
None |
Row filter or filter queue. |
roi |
string, list, or None |
None |
Select one ROI summary or run an ROI queue. |
share_columns_across_panels |
bool | True |
Keep only columns valid in every panel so panels are comparable. |
triangle |
None, 'full', 'lower', 'upper' |
None |
Mask one side of the matrix for compact display. |
show_diagonal |
bool | True |
Show self-correlation cells. |
show_values |
bool | False |
Write formatted numeric coefficients inside visible cells. |
value_format |
string or callable | '.2f' |
Format for show_values. |
save |
bool | True |
Write SVG figures to disk. |
group_col, group_cols, subject_col |
strings/list or None |
None |
DataFrame-adapter aliases for group, crossed-group, and subject columns. |
Returns
| Return value | Type | Meaning |
|---|---|---|
result |
dict |
Plot-run output keyed by condition, factor level, "Combined", ROI, or filter-queue item depending on the call. Leaf results contain heatmap and correlations. |
result[panel]["correlations"] |
dict |
Pair names such as "GFAP_Count vs Iba1_Count" mapped to (p_value, coefficient). |
Saved Outputs
With save=True, PyFLASH writes SVG heatmaps below the input object's figure
folder. The normal subfolder is Matrices/, with extra path or filename tags
for factor grouping, row filters, and ROI selection.
Filenames include the panel name, correlation method, optional triangle/value
variant label, and Correlation Matrix. If HTML export is enabled globally,
the function also attempts an HTML matrix export.
Examples
Minimal preview:
from PyFLASH.plotting import plot_matrices

result = plot_matrices(
    batch,
    data_cols=["GFAP_Count", "Iba1_Count", "NeuN_Count"],
    save=False,
)
Raw DataFrame with condition panels:
from PyFLASH.plotting import plot_matrices

result = plot_matrices(
    df,
    data_cols=["GFAP_Count", "Iba1_Count", "NeuN_Count"],
    group_col="Diagnosis",
    subject_col="AnimalName",
    split_by="Diagnosis",
    correlation="spearman",
    show_values=True,
    save=False,
)
Inspect a coefficient:
control = result.get("Control") or next(iter(result.values()))
p_value, r_value = control["correlations"]["GFAP_Count vs Iba1_Count"]
print(r_value, p_value)
Notes
plot_matrices drops non-numeric and sentinel-excluded values before
correlation. If fewer than two valid numeric columns remain in a panel, that
panel shows a "not enough valid numeric columns" message and returns an empty
correlation dictionary.
Significance stars are drawn from the selected pairwise correlation p-values.
The registry entry is currently describe-layer unreviewed, so use the return
dictionary or a pipeline result when you need structured numeric records.
For saved CSV matrices and significance-gated regression selection, use
correlation or adjusted_correlation.