plot_pie_charts
Summary
plot_pie_charts counts a marker-level attribute and displays the distribution
as pies or a combined stacked bar chart. It is useful for categorical marker
fields such as region, class, or manually binned numeric values.
Registry name: pie_charts.
Example figure
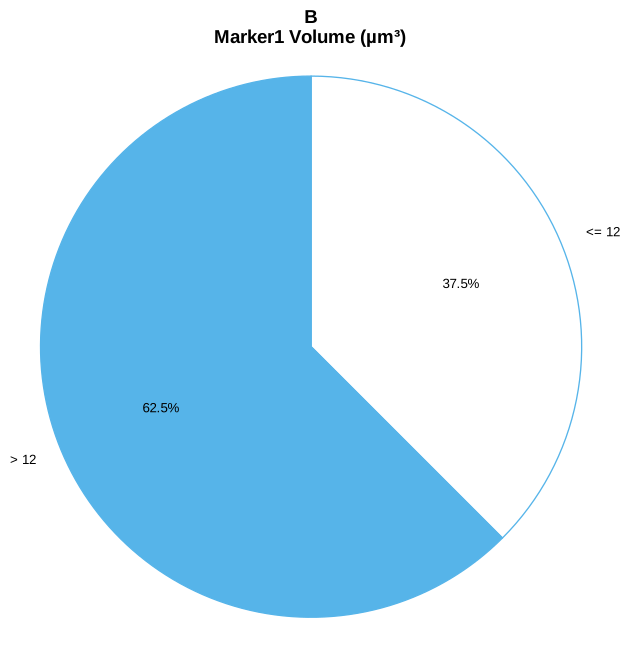
Marker1 volume split at a threshold of 12 (group B). Rendered from the synthetic example dataset.
Signature
plot_pie_charts(
    experiment,
    marker,
    x_attr,
    by="conditions",
    factor=None,
    threshold=None,
    start_angle=90,
    line_width=1.0,
    save=True,
    specificity=None,
    filter_by=None,
    roi=None,
    plot_format="pie",
    show_counts=None,
    show_pct=None,
    labels=None,
    order=None,
    include_N=False,
    as_counts=None,
    include_n=None,
    bottom_ticks=False,
    bottom_tick_labels=False,
    auto_style=True,
    style_cycle=None,
)
Input Object Types
| Object type | Accepted? | Notes |
|---|---|---|
Batch |
Yes | Main supported input. Reads experiment.data[marker].df. |
Experiment |
Yes | Works when marker tables and conditions are present. |
MiniExperiment |
Sometimes | Works only if the processed object exposes a marker table under data[marker]. |
pandas.DataFrame |
No | This wrapper does not accept raw tables directly. |
Parameters
| Parameter | Type | Default | Meaning |
|---|---|---|---|
experiment |
PyFLASH-like object | required | Source object with marker data and figure paths. |
marker |
str or list-like |
required | Marker table to count. List-like values queue all markers. |
x_attr |
str or list-like |
required | Attribute suffix or column resolved in the marker table. List-like values queue all attributes. |
by |
str |
"conditions" |
Grouping mode when factor is not set. |
factor |
str or None |
None |
Factor column to group by instead of full condition. |
threshold |
number, list-like, or None |
None |
Bin numeric values into <=t, (t1,t2], and >t categories. |
start_angle |
number | 90 |
Pie starting angle. The first ordered category starts at the top and proceeds clockwise. |
line_width |
number | 1.0 |
Wedge or stacked-bar edge width. Must be non-negative. |
save |
bool |
True |
Save figures under experiment.fig_path. |
filter_by |
dict, tuple, list, or None |
None |
Preferred row filter. Lists run queue mode. Legacy alias: specificity. |
roi |
str, list-like, or None |
None |
ROI-base selector. Multiple ROI bases run queue mode. |
plot_format |
str |
"pie" |
Accepted values: "pie" or "bar". Bar mode creates one stacked bar chart across groups. |
show_counts |
bool or None |
None |
Show raw counts in labels. |
show_pct |
bool or None |
None |
Show percentages in labels. |
labels |
dict or None |
None |
Map raw category labels to display labels. |
order |
list-like or None |
None |
Category order for slices or stacks. |
include_N |
bool |
False |
Add unique AnimalName count to labels. |
as_counts |
bool or None |
None |
Legacy value-label alias. |
include_n |
bool or None |
None |
Legacy alias for include_N. |
bottom_ticks, bottom_tick_labels |
bool |
False |
Tick visibility in stacked-bar mode. |
auto_style, style_cycle |
style controls | True, None |
Apply hatch/fill styles for groups sharing colours. |
Returns
| Return value | Type | Meaning |
|---|---|---|
result |
dict |
Standard PyFLASH iterator result. Includes pie_labels, pie_raw_labels, pie_counts, pie_percentages, group, and n_animals. |
result |
dict |
Queue mode returns dictionaries keyed by ROI, row filter, or (marker, x_attr) tuple. |
Saved Outputs
With save=True, pie figures are saved under a PieCharts plot folder using
names like:
Bar mode saves one combined stacked-bar figure:
The suffix includes row-filter and ROI context when relevant.
Examples
Plot one categorical attribute
from PyFLASH.plotting import plot_pie_charts

result = plot_pie_charts(
    batch,
    marker="GFAP",
    x_attr="Region",
    save=False,
)

print(result["pie_labels"])
print(result["pie_counts"])
Use stacked bars and show counts
plot_pie_charts(
    batch,
    marker="GFAP",
    x_attr="Region",
    plot_format="bar",
    show_counts=True,
    include_N=True,
    save=True,
)
Bin a numeric attribute
plot_pie_charts(
    batch,
    marker="GFAP",
    x_attr="GFAP_IntDen",
    threshold=[1000, 5000],
    labels={"<= 1000": "Low", "> 5000": "High"},
    save=False,
)
Notes
- The function resolves
x_attragainst the selected marker table. If the resolved column is missing, it raisesValueError. - In pie mode, zero-count categories are dropped. In bar mode, zero categories are kept so the shared category order remains stable.
show_countsalone makes stacked bars use raw counts. Otherwise bar mode uses percentages.- The count of contributing subjects is based on unique
AnimalNamevalues in rows with valid plotted categories. - The plot is describe-layer exempt because it reports descriptive proportions, not an inferential test.