plot_matrix_differences
Summary
plot_matrix_differences compares correlation matrices between groups. It is
registered as matrix_differences.
For each requested comparison, it computes each group's correlation matrix and
then summarizes left - right and abs(left - right) for every cell. Pearson
matrices can also receive Fisher r-to-z p-values, FDR q-values, and gate
matrices.
Example figure
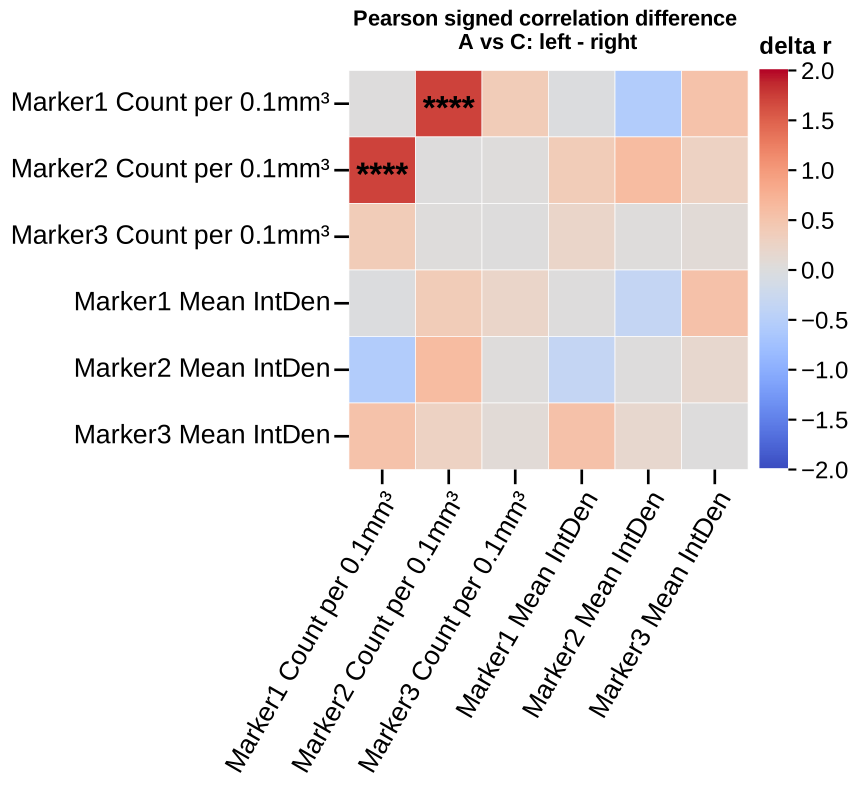
Signed correlation-matrix difference between groups A and C (Fisher z). Rendered from the synthetic example dataset.
Signature
plot_matrix_differences(experiment, filtered_columns=None, data_cols=None, against_columns=None, against_data_cols=None, by='conditions', factor=None, comparisons=None, specificity=None, split_by=None, filter_by=None, roi=None, save=True, column_strings=None, regex_string=None, exclude='', data_col_contains=None, data_col_regex=None, data_col_exclude=None, against_column_strings=None, against_regex_string=None, against_exclude='', against_data_col_contains=None, against_data_col_regex=None, against_data_col_exclude=None, correlation='pearsonr', alpha=0.05, min_n=3, difference_gate='p', difference_test='fisher_z', plot_signed=True, plot_absolute=True, value_matrices='p', plot_pvalue_matrices=None, plot_qvalue_matrices=None, plot_gate_matrix=True, tick_label_size=20, run_label=None, condition_col='Condition', factor_cols=None, animal_col='AnimalName', group_list=None, groups=None, group_col=None, group_cols=None, subject_col=None, dataframe_kwargs=None)
Input Object Types
| Object type | Accepted? | Notes |
|---|---|---|
Batch |
Yes | Main supported input. |
Experiment |
Yes | Works with .summary, .condition_list, and figure paths. |
MiniExperiment |
Yes | Works for summary-style data. |
pandas.DataFrame |
Yes | Wrapped internally; pass group_col and subject_col when needed. |
Parameters
| Parameter | Type | Default | Meaning |
|---|---|---|---|
experiment |
Batch, experiment-like object, or DataFrame |
required | Data source containing a summary table. |
data_cols / filtered_columns |
list-like or None |
None |
Row-side columns. In square mode these also form the column side. |
against_data_cols / against_columns |
list-like or None |
None |
Optional column-side set for rectangular matrix differences. |
by / split_by |
string | 'conditions' |
Grouping source used to build matrices. |
factor |
string or None |
None |
Explicit factor column for group matrices. |
comparisons |
list-like or None |
None |
Pairwise group comparisons. Strings such as "1-2" use the current group order. |
correlation |
string or sequence | 'pearsonr' |
One or more methods: Pearson, Spearman, Kendall, or aliases. |
alpha |
float | 0.05 |
Significance threshold for p/q gates and annotations. |
min_n |
int | 3 |
Minimum complete pairs for each group-level correlation. |
difference_gate |
string | 'p' |
Gate source for difference significance: raw p-values or FDR q-values. |
difference_test |
string | 'fisher_z' |
Difference-test backend. Currently inferential for Pearson; other methods are descriptive. |
plot_signed, plot_absolute |
bool | True, True |
Save signed and absolute difference heatmaps. |
value_matrices |
string | 'p' |
Which inferential value heatmaps to save: 'p', 'q', 'both', or 'none'. |
plot_gate_matrix |
bool | True |
Save a binary gate heatmap for inferential Pearson differences. |
run_label |
string or None |
None |
Output folder label. Auto-derived when omitted. |
filter_by / specificity |
mapping, tuple, list, or None |
None |
Row filter. |
roi |
string or None |
None |
Select an ROI summary. |
save |
bool | True |
Write figures, CSVs, and manifest. |
Returns
| Return value | Type | Meaning |
|---|---|---|
result |
dict |
Manifest-style dictionary for the run. |
result["differences"] |
pandas.DataFrame |
Long table with comparison, left_group, right_group, x, y, method, r_left, r_right, signed_delta, absolute_delta, p, q, passes, and difference_test. |
result["comparisons"] |
list[dict] |
Per-comparison summaries including method names and significant counts. |
result["fig_dir"], result["data_dir"] |
strings | Intended output folder. They are the same folder for this standalone plot. |
Saved Outputs
With save=True, PyFLASH writes to:
Saved files can include:
manifest.jsonmatrix_differences_all.csv- per-comparison long CSVs such as
matrix_differences_<comparison>.csv - signed delta CSVs and SVGs
- absolute delta CSVs and SVGs
- Pearson-only p-value, q-value, and gate CSVs/SVGs when enabled
Spearman and Kendall difference matrices are saved as descriptive signed and absolute differences, but they do not get p/q/gate files in the current implementation.
Examples
Minimal group comparison:
from PyFLASH.plotting import plot_matrix_differences

result = plot_matrix_differences(
    batch,
    data_cols=["GFAP_Count", "Iba1_Count", "NeuN_Count"],
    factor="Diagnosis",
    comparisons=["1-2"],
    run_label="diagnosis_matrix_difference",
)
Rectangular difference matrices:
result = plot_matrix_differences(
    batch,
    data_cols=["GFAP_Count", "Iba1_Count"],
    against_data_cols=["Age", "BehaviourScore"],
    factor="Diagnosis",
    correlation=("pearsonr", "spearmanr"),
    value_matrices="both",
    run_label="marker_covariate_differences",
)
Inspect the returned table:
diffs = result["differences"]
top = diffs.sort_values("absolute_delta", ascending=False).head(10)
print(top[["comparison", "method", "x", "y", "signed_delta", "p", "q"]])
Notes
The sign is left_group - right_group, where left and right come from the
resolved comparison order. A positive signed delta means the correlation is
larger in the left group.
difference_gate="fdr" uses q-values when available. Fisher r-to-z testing is
implemented for independent Pearson correlations; Spearman and Kendall rows are
marked descriptive_only.
This standalone plot is useful for targeted comparisons. For end-to-end
correlation discovery that also writes coefficient, p-value, q-value, gate, and
selected regression outputs, use correlation or
adjusted_correlation.
The registry entry is describe-layer unreviewed; use the returned
differences table for machine-readable values.