plot_coloc_upset
Summary
plot_coloc_upset detects binary colocalisation indicator columns for a marker
and plots their intersections as an UpSet plot. Use it when several
colocalisation flags can overlap and a pie chart would hide the intersection
structure.
Registry name: coloc_upset.
Example figure
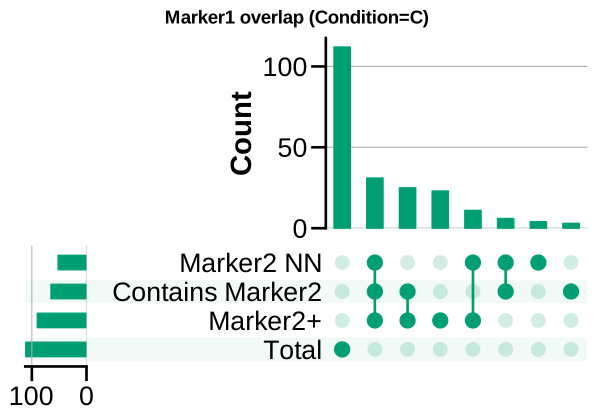
UpSet plot of Marker1–Marker2 colocalisation sets (group C). Rendered from the synthetic example dataset.
Signature
plot_coloc_upset(
    source,
    marker,
    *,
    specificity=None,
    filter_by=None,
    roi=None,
    by=None,
    remove_closest=False,
    include_neither=False,
    min_count=1,
    normalize=False,
    sort_by="cardinality",
    title=None,
    save=True,
    df=None,
    experiment=None,
    dpi=110,
)
Input Object Types
| Object type | Accepted? | Notes |
|---|---|---|
Batch |
Yes | Main supported input. Reads source.data[marker].df and uses summary metadata for grouping. |
Experiment |
Yes | Works with marker data and condition metadata. |
MiniExperiment |
Sometimes | Works only if the marker table has colocalisation indicator columns. |
pandas.DataFrame |
Yes | Used directly as the marker table. Pass experiment for save-path and grouping context when needed. |
Parameters
| Parameter | Type | Default | Meaning |
|---|---|---|---|
source |
PyFLASH-like object or DataFrame |
required | Marker data source. |
marker |
str or list-like |
required | Base marker. A list queues one UpSet plot per marker. |
filter_by |
dict, tuple, list, or None |
None |
Preferred row filter. Lists run queue mode. Legacy alias: specificity. |
roi |
str, list-like, or None |
None |
ROI-base selector. Multiple ROI bases run queue mode. |
by |
str or None |
None |
Group panels. None auto-groups by condition only when multiple conditions remain. |
remove_closest |
bool |
False |
Exclude <marker>_ClosestTo_<other> columns. |
include_neither |
bool |
False |
Include the all-false intersection. |
min_count |
int |
1 |
Hide intersections with fewer rows. |
normalize |
bool |
False |
Plot percent of panel rows instead of raw counts. |
sort_by |
str |
"cardinality" |
UpSet sorting mode. Common values: "cardinality" or "degree". |
title |
str or None |
None |
Base plot title. |
save |
bool |
True |
Save figures when an experiment context is available. |
df |
pandas.DataFrame or None |
None |
Optional pre-filtered marker table override for one marker. |
experiment |
PyFLASH-like object or None |
None |
Legacy/context object for DataFrame input and saving. |
dpi |
int |
110 |
Figure DPI. |
Returns
| Return value | Type | Meaning |
|---|---|---|
fig |
matplotlib.figure.Figure |
Returned for one combined panel. |
outputs |
dict |
Returned when grouped, queued, or run over several markers. Values are Matplotlib figures or nested dictionaries. |
Saved Outputs
With save=True and an experiment context, figures are saved under an UpSet
plot folder below exp_obj.fig_path. Saved names include:
rawcountsornormalized;withClosestornoClosest;- condition or factor tags when grouped;
- row-filter and ROI suffixes when relevant.
The function requires the optional upsetplot package.
Examples
Plot one marker without saving
from PyFLASH.plotting import plot_coloc_upset

fig = plot_coloc_upset(
    batch,
    marker="GFAP",
    include_neither=False,
    save=False,
)
Group by condition and normalize to percent
figures = plot_coloc_upset(
    batch,
    marker="GFAP",
    by="conditions",
    normalize=True,
    remove_closest=True,
    save=True,
)

print(figures.keys())
Use a pre-filtered DataFrame
marker_df = batch.data["GFAP"].df

fig = plot_coloc_upset(
    marker_df,
    marker="GFAP",
    experiment=batch,
    by="Diagnosis",
    save=False,
)
Notes
- Detected indicator columns follow these patterns:
<marker>_ColocCount<other>,<marker>_ClosestTo_<other>, and<marker>_Contains_<other>. - Numeric, boolean, and common text encodings are coerced to true/false. Missing values are treated as false.
- In raw-count mode, the function prepends a synthetic
Totalintersection. - If no detected colocalisation columns exist, the function raises
ValueErrorand reports the expected patterns. - The plot is describe-layer exempt because it is a descriptive colocalisation-count view.