plot_locations
Summary
plot_locations draws marker object coordinates as spatial panels. It can show
raw object locations, merged marker panels, filtered extra panels, colocaliser
panels, optional image backgrounds, and ROI outlines.
Registry name: locations.
Example figure
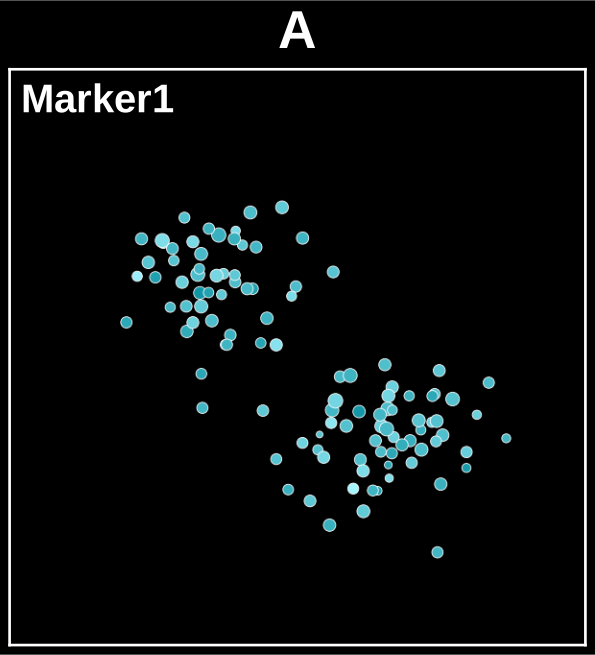
Spatial map of one subject's Marker1 object locations (points-only mode). Rendered from the synthetic example dataset.
Signature
plot_locations(
    experiment,
    objects,
    separate_by="groups",
    join_by="subjects",
    merge=True,
    colocalise=True,
    annotate=True,
    extra_graphs=None,
    images=None,
    colocaliser=None,
    extra_graph_colors=None,
    image_layout="shared",
    draw_rois=None,
    hue=True,
    marker_colors=None,
    black_background=False,
    panel_line_width=2.0,
    dpi=100,
    save=True,
    fast_loading=False,
    preview_max_dim=None,
    image_adjustments=None,
    edit_mode=False,
    use_existing_edits=False,
    specificity=None,
    filter_by=None,
    roi=None,
    extra_graph=None,
    merge_extra_graphs=None,
    overlay_with_images=None,
    draw_roi=None,
    overlay_all_extra_graphs=None,
    _return_fig=False,
)
Input Object Types
| Object type | Accepted? | Notes |
|---|---|---|
Batch |
Yes | Main supported input. Needs marker tables, group metadata, summary, and region mappings. |
Experiment |
Yes | Works when marker coordinate tables and ROI metadata are available. |
MiniExperiment |
Usually no | Only works if converted data expose the same marker-coordinate structure. |
pandas.DataFrame |
No | A raw summary table does not carry marker data, region dictionaries, or image paths. |
Parameters
| Parameter | Type | Default | Meaning |
|---|---|---|---|
experiment |
Batch or Experiment |
required | Source object with marker data and group metadata. |
objects |
marker spec | required | Marker panels to plot as object coordinates. Strings make one panel; tuples merge markers into one panel. |
separate_by |
str |
"groups" |
Outer figure grouping. Common values: "groups" or "subjects". Legacy/internal aliases: "conditions" and "animals". |
join_by |
str |
"subjects" |
Rows within a figure. Common values: "subjects" or "rois". Legacy/internal alias: "animals". |
merge |
bool |
True |
Merge marker panels where marker specs request combined panels. |
colocalise |
bool |
True |
Preserve legacy colocalisation behaviour for object panels. |
annotate |
bool |
True |
Label panels with marker or overlay names. |
extra_graphs |
column spec or None |
None |
Extra boolean columns to render as filtered panels. Tuples overlay several filters in one panel. |
images |
marker spec or None |
None |
Image marker panels to draw as backgrounds or side-by-side panels. |
colocaliser |
bool, str, list, or None |
None |
Add panels using detected <object>_Contains_<marker> columns. |
extra_graph_colors |
colour spec or None |
None |
Colours for extra filtered panels. |
image_layout |
str |
"shared" |
"shared" overlays points on image axes; "separate" places images beside points. |
draw_rois |
bool, marker-panel spec, or None |
None |
Draw ROI outlines on matching image panels. |
hue |
bool |
True |
Colour points by <marker>_IntDen when available. |
marker_colors |
dict or None |
None |
Override marker colours. |
black_background |
bool |
False |
Use black figure and axes backgrounds. |
panel_line_width |
float |
2.0 |
Width of panel separator spines. |
dpi |
int |
100 |
Figure resolution. |
save |
bool |
True |
Save figures under the standard figure folder. |
fast_loading |
bool |
False |
Use preview loading for image overlays. |
preview_max_dim |
int or None |
None |
Downsample image overlay previews. |
image_adjustments |
dict or None |
None |
Per-marker brightness/contrast settings. |
edit_mode |
bool |
False |
Open the image-adjustment editor for image overlays. |
use_existing_edits |
bool |
False |
Reuse saved image adjustments. |
filter_by |
dict, tuple, list, or None |
None |
Preferred row filter. Lists run queue mode. Legacy alias: specificity. |
roi |
str, list-like, or None |
None |
ROI-base selector. Multiple ROI bases run queue mode. |
Returns
| Return value | Type | Meaning |
|---|---|---|
result |
dict |
Standard PyFLASH iterator result, usually accumulated action records. |
result |
dict |
In ROI or row-filter queue mode, a dictionary keyed by ROI or filter value. |
The internal _return_fig=True path returns the Matplotlib figure used for UI
preview/edit mode. Normal user calls should use saved files or the iterator
result dictionary.
Saved Outputs
With save=True, figures are saved under the Locations plot folder below
experiment.fig_path. Saved names include the outer group name, panel tag,
join_by value, row-filter suffix, and ROI suffix when relevant.
No tables are written by this function.
Examples
Plot one marker by group and subject
from PyFLASH.plotting import plot_locations

plot_locations(
    batch,
    objects=["GFAP"],
    separate_by="groups",
    join_by="subjects",
    save=True,
)
Overlay coordinates on images
plot_locations(
    batch,
    objects=["GFAP"],
    images=["DAPI"],
    image_layout="shared",
    draw_rois=True,
    fast_loading=True,
    preview_max_dim=1024,
    save=True,
)
Add filtered colocalisation panels
result = plot_locations(
    batch,
    objects=["Caspase3"],
    extra_graphs=["Caspase3_Contains_mCherry"],
    extra_graph_colors={"Caspase3_Contains_mCherry": "magenta"},
    save=False,
)

print(result)
Notes
- Marker coordinate columns are resolved as
<marker>_XMand<marker>_YM. Optional colour and size columns are<marker>_IntDenand<marker>_Volume. imagesrequires imported image metadata. Without it, keepimages=None.draw_rois=Trueonly draws outlines where ROI coordinate or bounds metadata can be matched to the panel.image_layout="shared"cannot use more image panels than object panels.extra_graphanddraw_roiare legacy aliases forextra_graphsanddraw_rois.