plot_group_matrix
Summary
plot_group_matrix computes subject-level Hedges g for each selected marker and
each group-vs-control contrast, then draws a marker x comparison heatmap. It is
registered as group_matrix in PyFLASH.spec.PLOT_REGISTRY.
Use it to scan the direction and size of many group differences at once.
Example figure
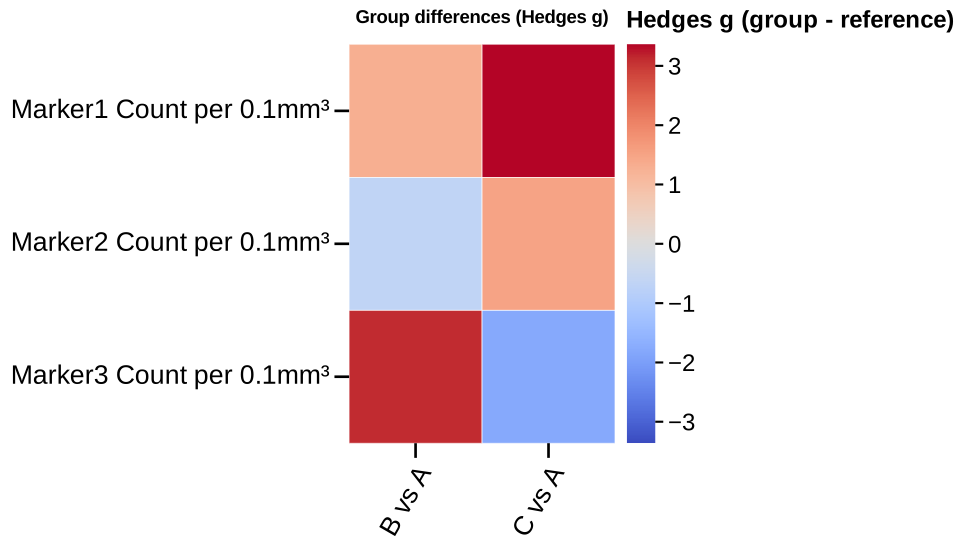
Marker × group signed-Hedges-g matrix vs control A. Rendered from the synthetic example dataset.
Signature
plot_group_matrix(
    experiment,
    filtered_columns=None,
    data_cols=None,
    by="conditions",
    factor=None,
    specificity=None,
    split_by=None,
    filter_by=None,
    roi=None,
    control=None,
    alpha=0.05,
    effect_ci=False,
    n_resamples=2000,
    min_n=3,
    tick_label_size=20,
    save=True,
    column_strings=None,
    regex_string=None,
    exclude="",
    data_col_contains=None,
    data_col_regex=None,
    data_col_exclude=None,
    condition_col="Condition",
    factor_cols=None,
    animal_col="AnimalName",
    group_list=None,
    groups=None,
    group_col=None,
    group_cols=None,
    subject_col=None,
    dataframe_kwargs=None,
)
Input Object Types
| Object type | Accepted? | Notes |
|---|---|---|
Batch |
Yes | Main supported input. Uses summary, condition_list, and fig_path. |
Experiment |
Yes | Works when it exposes the same summary and condition attributes. |
MiniExperiment |
Usually | Works for summary-style data when required columns exist. |
pandas.DataFrame |
Yes | Provide group_col and subject_col, or a groupList/groups. |
Parameters
| Parameter | Type | Default | Meaning |
|---|---|---|---|
experiment |
Batch, Experiment, or pandas.DataFrame |
required | Data source. |
data_cols |
list-like or None |
None |
Exact data columns to analyze. Preferred public name. |
filtered_columns |
list-like or None |
None |
Exact summary columns to compare. Internal/legacy name. |
by |
str |
"conditions" |
Grouping mode. Common values are "conditions" and "all". |
factor |
str or None |
None |
Group by a factor column instead of main condition groups. |
split_by |
str or None |
None |
Public grouping alias. Values such as a column name usually resolve to factor. |
filter_by |
dict, tuple, queue, or None |
None |
Preferred public row filter before grouping. Legacy alias: specificity. |
roi |
str, list-like, or None |
None |
ROI-base selector. Multiple ROI bases return a queue dictionary. |
control |
str or None |
None |
Reference group. If omitted, the first resolved group is used. Matching is case-insensitive. |
alpha |
number | 0.05 |
Kept for the shared renderer. The standalone matrix does not mark significance because it has no p-value column. |
effect_ci |
bool |
False |
Compute bootstrap intervals during effect calculation. Intervals are not displayed in the matrix. |
n_resamples |
int |
2000 |
Bootstrap resamples used when effect_ci=True. |
min_n |
int |
3 |
Minimum finite subject-level values required in both reference and comparison groups. |
tick_label_size |
number | 20 |
Base font size for labels and title. |
save |
bool |
True |
Save the SVG figure under the input object's figure folder. |
group_col |
str or None |
None |
Preferred public grouping column. Legacy alias: condition_col. |
group_cols |
list-like or None |
None |
Preferred public crossed-group columns. Legacy alias: factor_cols. |
subject_col |
str or None |
None |
Subject/sample ID column. Legacy alias: animal_col. |
group_list |
groupList or None |
None |
Optional group metadata for raw DataFrame input. |
groups |
groupList or None |
None |
Alternative public spelling for group_list. |
data_col_contains |
str, list-like, or None |
None |
Include data columns whose names contain these strings. Preferred public name. |
data_col_regex |
str or None |
None |
Include data columns matching this regex. Preferred public name. |
data_col_exclude |
str, list-like, or None |
None |
Exclude matching data columns after selection. Preferred public name. |
condition_col |
str |
"Condition" |
Legacy alias for group_col. |
factor_cols |
list-like or None |
None |
Legacy alias for group_cols. |
animal_col |
str |
"AnimalName" |
Legacy alias for subject_col. |
column_strings |
str, list-like, or None |
None |
Legacy/internal alias for data_col_contains. |
regex_string |
str or None |
None |
Legacy/internal alias for data_col_regex. |
exclude |
str or list-like |
"" |
Legacy/internal alias for data_col_exclude. |
dataframe_kwargs |
dict or None |
None |
Advanced from_dataframe options. |
Returns
| Return value | Type | Meaning |
|---|---|---|
| fig | matplotlib.figure.Figure |
Heatmap figure. |
None |
None |
Returned when no finite effect sizes are available. |
| queued result | dict |
When roi or filter_by is queued, returns nested dictionaries keyed by ROI base or filter. |
Saved Outputs
When save=True, one SVG is written below experiment.fig_path, normally in a
Group Matrix subfolder.
Common filename:
Specificity and ROI suffixes are added when those filters are active.
Examples
Plot a group matrix from a processed batch
from PyFLASH.plotting import plot_group_matrix

fig = plot_group_matrix(
    batch,
    data_cols=["GFAP_Count", "Iba1_Count"],
    control="Control",
    save=False,
)
Use a raw summary DataFrame
fig = plot_group_matrix(
    df,
    data_cols=["GFAP_Count", "Iba1_Count"],
    group_col="Diagnosis",
    subject_col="Subject ID",
    control="Control",
    min_n=2,
    save=False,
)
Filter rows before computing effects
plot_group_matrix(
    batch,
    data_col_contains="GFAP",
    filter_by={"Time": "WeekEight"},
    control="Control",
)
Reuse the returned figure
fig = plot_group_matrix(batch, data_cols=["GFAP_Count"], save=False)

if fig is not None:
    fig.axes[0].set_title("GFAP effect-size matrix")
Notes
- Hedges g is computed as
comparison group - reference group. Positive cells indicate larger values in the comparison group than in the control. - The standalone matrix shows effect-size magnitude and direction only. It does not annotate p-values or q-values.
- For an inferential matrix with significance annotations, use the
group_comparisonpipeline. group_matrixis describe-layer exempt as a standalone descriptive plot.